Disclaimer: This blogpost is not about a specific book, titled Tracers in the Dark: The Global Hunt for the Crime Lords of Cryptocurrency. It’s just about execution traces.
I wanted to explore a few techniques for visualising inter-dependencies between fragments of code, modules, etc. Say, you have multiple functions and you want to get some bearing on how much each execution of each of those functions takes. Or you have a complicated system, and you’d like to plot remote calls in this system.
Either way - it’s about drawing relations between objects in time.
If thinking locally - this might mean you can resort to some variation of flame graphs. Popularized by Brendan Gregg with his tool FlameGraph:
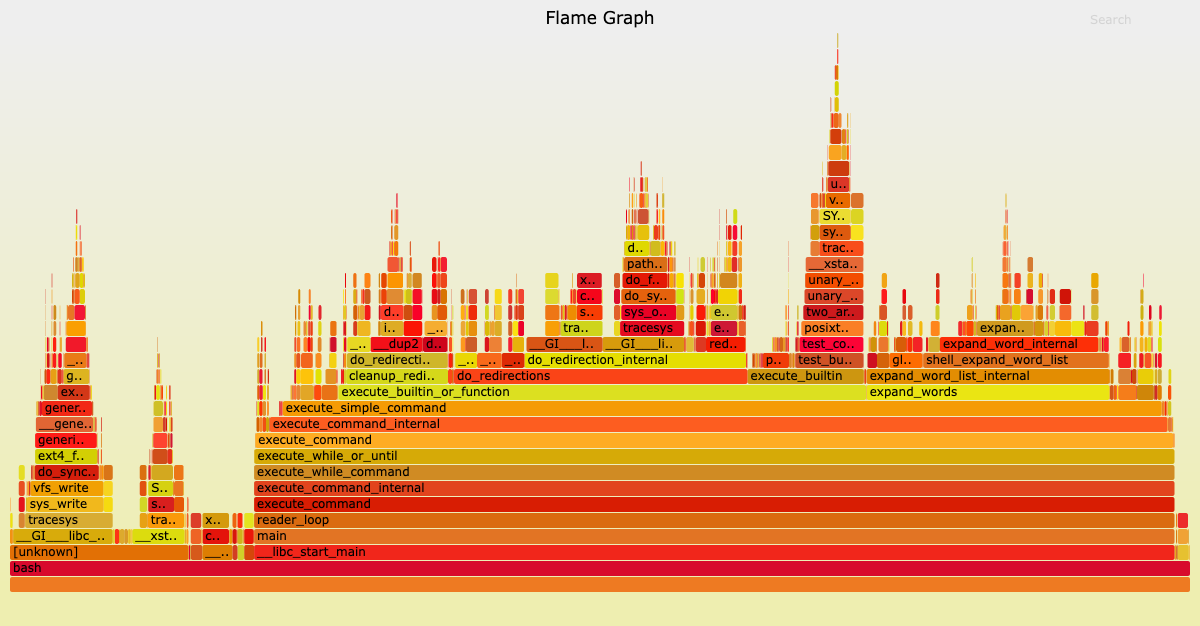
But let’s just say, you want to plot something completely different, and want to use tools that are already there to display the depencencies.
Mermaid
You might want to go with something a lot simpler. Eg. to add some spice to your docs, generated from code snippets, etc.
You could leverage Mermaid diagrams to generate Gantt diagrams, easily reusable for shorter traces. Of course, there are sequence diagrams in Mermaid, and you could use those. But I don’t find them too readable for anything like traces.
An example trace can look like this:
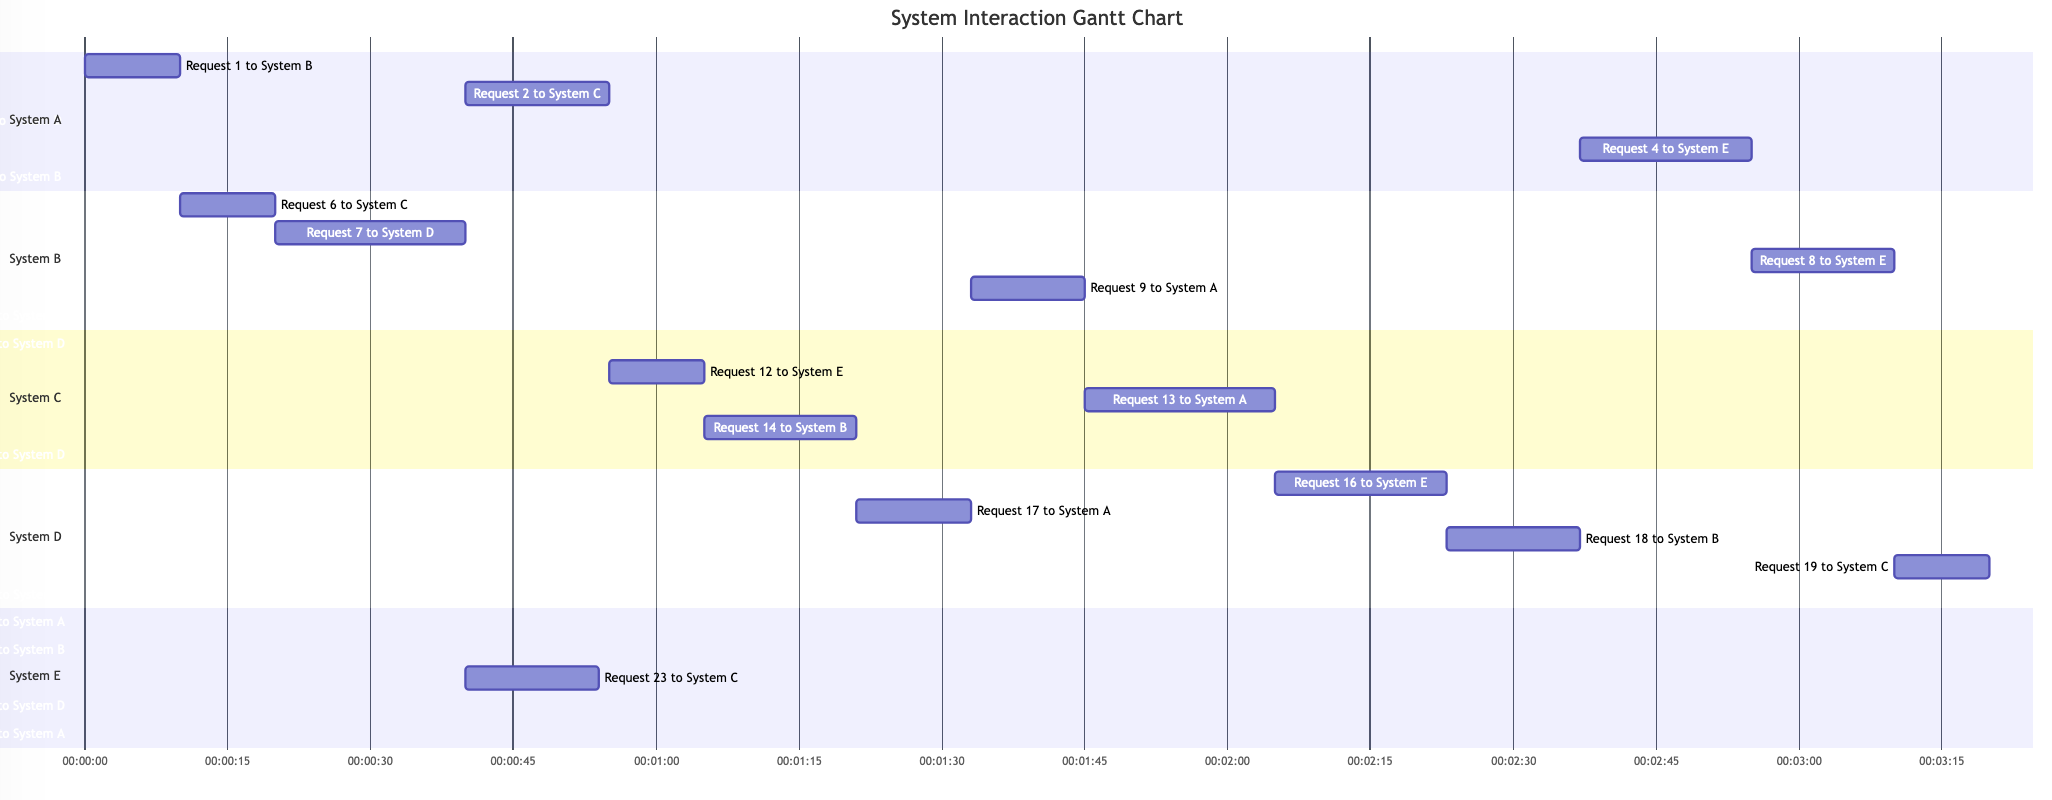
The code that produced it is here, and you can play with it here:
gantt
	title System Interaction Gantt Chart
	dateFormat YYYY-MM-DD HH:mm:ss
	axisFormat %H:%M:%S

	section System A
	Request 1 to System B :a1, 2024-08-08 00:00:00, 10s
	Request 2 to System C :a2, after b2, 15s
	Request 3 to System D :a3, after c1, 12s
	Request 4 to System E :a4, after d3, 18s
	Request 5 to System B :a5, after e4, 10s

	section System B
	Request 6 to System C :b1, after a1, 10s
	Request 7 to System D :b2, after b1, 20s
	Request 8 to System E :b3, after a4, 15s
	Request 9 to System A :b4, after d2, 12s
	Request 10 to System C :b5, after e1, 10s

	section System C
	Request 11 to System D :c1, after b5, 14s
	Request 12 to System E :c2, after a2, 10s
	Request 13 to System A :c3, after b4, 20s
	Request 14 to System B :c4, after c2, 16s
	Request 15 to System D :c5, after e2, 10s

	section System D
	Request 16 to System E :d1, after c3, 18s
	Request 17 to System A :d2, after c4, 12s
	Request 18 to System B :d3, after d1, 14s
	Request 19 to System C :d4, after b3, 10s
	Request 20 to System E :d5, after a3, 20s

	section System E
	Request 21 to System A :e1, after d5, 16s
	Request 22 to System B :e2, after c1, 12s
	Request 23 to System C :e3, after b2, 14s
	Request 24 to System D :e4, after c5, 18s
	Request 25 to System A :e5, after a5, 10s
Google Chrome profiling tool
One non-obvious tool for that is Google Chrome’s Profiling Tool. You can access it by typing about:tracing in your Chrome address bar. Well, it seems the tool is deprecated but at least at the moment of writing (Aug 2024), it’s still there and can be used.
The recommended way is to use its evolution https://ui.perfetto.dev/
Actually it’s pretty neat, as with that migration the profiler is now usable from any modern web browser - at least from my point of view. Perhaps there are some Chrome-specific functionalities there, but they’re not important right now as I’m interested in just plotting external data.
I’ve plotted an example data here:
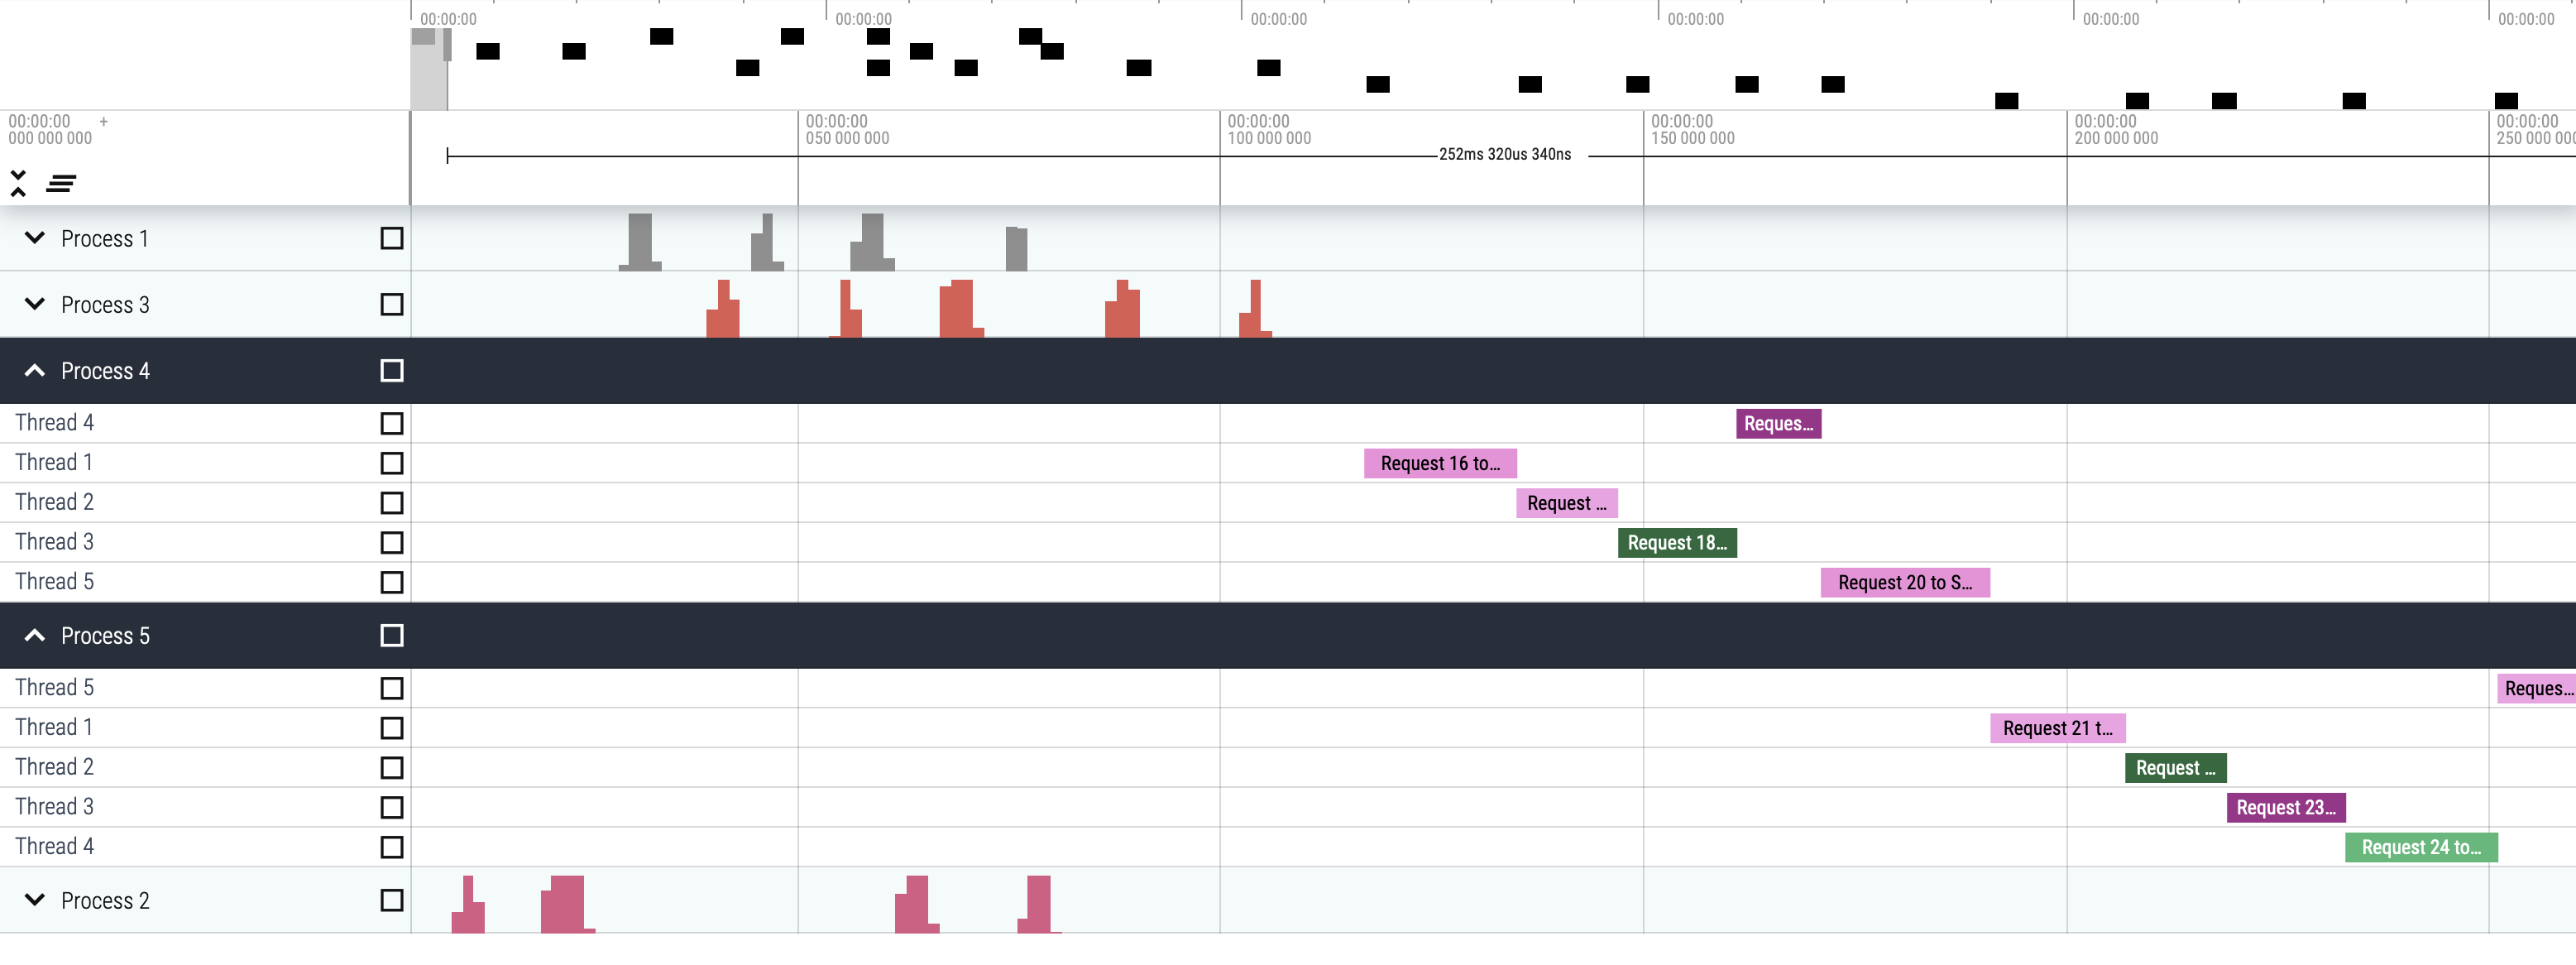 And the data I’ve imported here, should be exactly what I’ve plotted in
 Mermaid. I’ve produced this simple script to convert one format to another (actually my LLM Agent helped me with that ;-) ):
import json
import re
from datetime import datetime, timedelta

def parse_mermaid_gantt(mermaid_code):
    tasks = []
    pattern = r'(\w+ \d+ to \w+ \w+)\s+:\w+, after ([\w\d]+), (\d+)s'

    base_time = datetime(2024, 8, 8, 0, 0, 0)
    task_times = {}

    # Parse each line to extract task details
    for line in mermaid_code.splitlines():
        match = re.search(pattern, line)
        if match:
            task_name = match.group(1)
            depends_on = match.group(2)
            duration = int(match.group(3)) * 1000  # convert to microseconds

            # Calculate start time
            start_time = task_times[depends_on]
            task_start = start_time + timedelta(milliseconds=1)

            tasks.append({
                "name": task_name,
                "cat": task_name.split(' to ')[1],
                "ph": "X",
                "ts": int(task_start.timestamp() * 1e6),
                "dur": duration,
                "pid": len(tasks) + 1,
                "tid": 1,
            })

            task_times[task_name] = task_start + timedelta(microseconds=duration)

        else:
            # Handle initial tasks with direct timestamp
            pattern_direct = r'(\w+ \d+ to \w+ \w+)\s+:\w+, (\d{4}-\d{2}-\d{2} \d{2}:\d{2}:\d{2}), (\d+)s'
            match_direct = re.search(pattern_direct, line)
            if match_direct:
                task_name = match_direct.group(1)
                timestamp = datetime.strptime(match_direct.group(2), '%Y-%m-%d %H:%M:%S')
                duration = int(match_direct.group(3)) * 1000  # convert to microseconds

                tasks.append({
                    "name": task_name,
                    "cat": task_name.split(' to ')[1],
                    "ph": "X",
                    "ts": int(timestamp.timestamp() * 1e6),
                    "dur": duration,
                    "pid": len(tasks) + 1,
                    "tid": 1,
                })

                task_times[task_name] = timestamp + timedelta(microseconds=duration)

    return tasks


def convert_to_chrome_profiler_json(mermaid_code):
    tasks = parse_mermaid_gantt(mermaid_code)
    profile_data = {"traceEvents": tasks}
    return json.dumps(profile_data, indent=4)


# Example Mermaid Gantt code input
mermaid_code = """
    gantt
    dateFormat  YYYY-MM-DD HH:mm:ss
    axisFormat  %H:%M:%S
    section System A
    Request 1 to System B  :a1, 2024-08-08 00:00:00, 10s
    Request 2 to System C  :a2, after b2, 15s
    section System B
    Request 6 to System C  :b1, after a1, 10s
    Request 7 to System D  :b2, after b1, 20s
    section System C
    Request 11 to System D :c1, after b5, 14s
"""

# Convert the Mermaid Gantt code to Chrome Profiler JSON
chrome_profiler_json = convert_to_chrome_profiler_json(mermaid_code)

# Save JSON to a file
with open("chrome_profiler.json", "w") as f:
    f.write(chrome_profiler_json)

print("JSON data has been saved to chrome_profiler.json")
Conclusion
As you can see - the task at hand can be accomplished in at least one way. Probably there are a lot more tools like this, so if you’d like to share an interesting thing here - please do!